How I got nerd sniped into benchmarking legacy x86 instructions
It all started with a meme tweet:
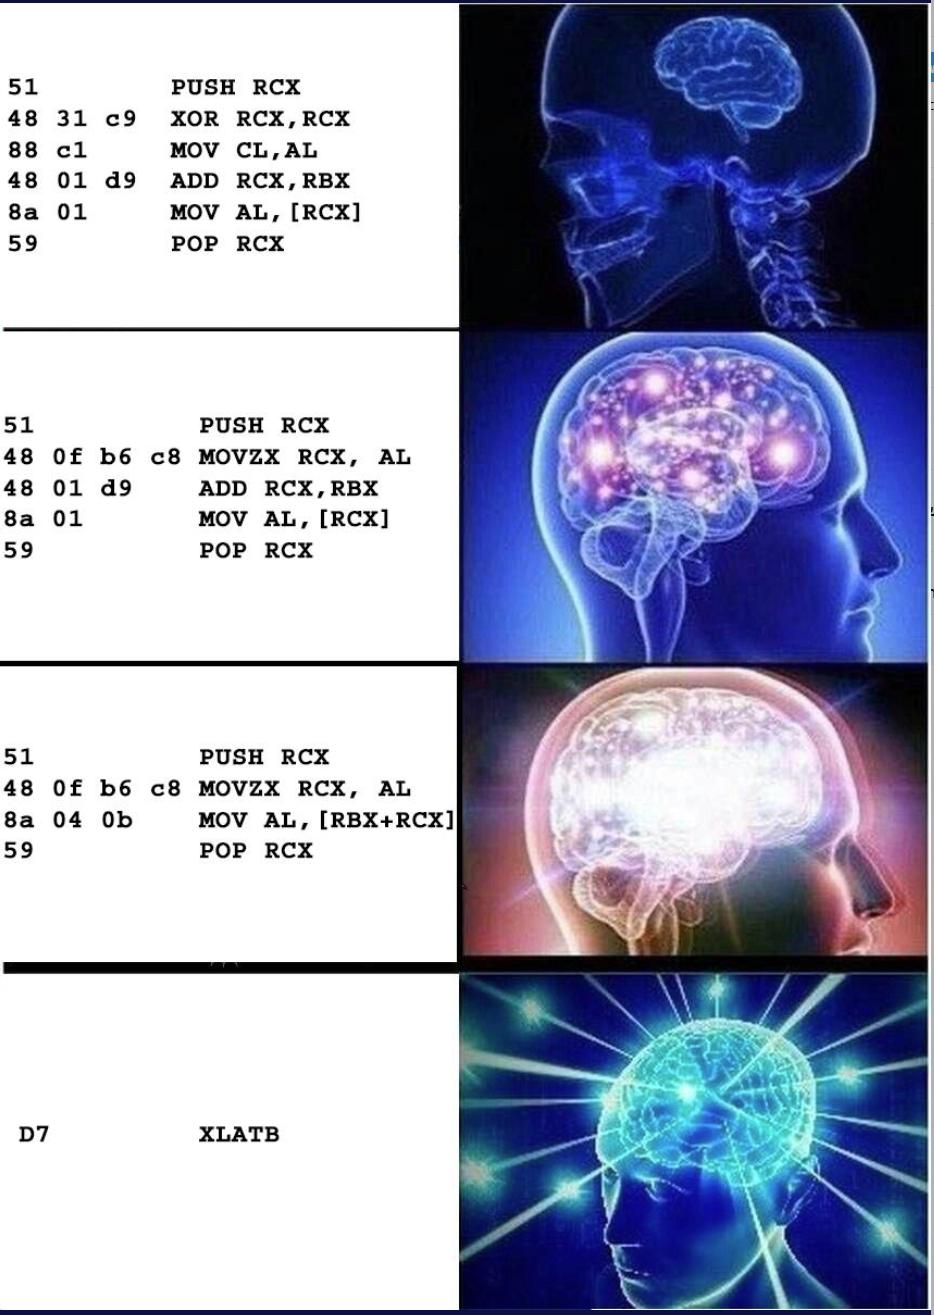
Laugh, scroll past, then I started wondering, “what are the chances this obscure opcode is faster than optimized loads?” and I realized I had just been nerd sniped. So I decided to dig up my half-remembered memories of how to benchmark opcodes and get to the bottom of this meme.
For those of us who do not recall every opcode that Intel dreamed up, the Intel reference manual is a useful reference and says the following:
XLAT/XLATB - Locates a byte entry in a table in memory, using the contents of the AL register as a table index, then copies the contents of the table entry back into the AL register. The index in the AL register is treated as an unsigned integer. The XLAT and XLATB instructions get the base address of the table in memory from either the DS:EBX or the DS:BX registers
In other words, the instruction performs
MOV AL,[EBX+AL];EBX is the array base and AL is the offset.
Which is exactly the core line of the last snippet in the meme.
My guess was the equivalent load opcode version would outperform xlatb. How I tested this simple question is worth writing up, if only to have a reference for micro benchmarking from end to end.
Technical background
Feel free to skip this if you’re familiar with benchmarking, CISC vs RISC and why I guessed what I guessed
Benchmarking
What I did to test my guess is called micro benchmarking. The difference from regular benchmarking is in the focus and minimization of context. It helps in answering very small questions such as “What is the fastest way to sort an array of numbers in C”, and ignoring memory pressure, design and other considerations that are important in the real world of benchmarking.
The challenge in micro benchmarking is that there is a lot of noise in the process. Compilers, operating systems, CPU temperature and frequency changes can all serve to create large shifts in the performance of the benched code snippet.
Therefore, the goal is to define the problem as accurately as possible. For example
- Minimize hardware considerations. This means removing frequency scaling, branching, any chance of the data being evicted from the cache.
- No interaction with the system. This means no system calls, but also no memory allocations and hopefully remove the role the runtime plays (for example if we’re benchmarking .NET code)
These typically lead micro benchmarks to being written in assembly code and measuring runtime using the rdtsc opcode.
To understand this at a basic level, I really recommend the book Inside the Machine (Jon Stokes), another option is Modern Microprocessors in 90 minutes but for more than that, the relatively up to date reference is Real World Technologies articles on CPU architecture.
The reference for nearly everything relating to opcode latency for Intel and AMD CPUs is Agners guides and uops.info.
If you want to measure these latencies and what exactly a CPU is doing when executing an opcode, you need to read the Performance Measurement Counters embedded in the hardware. This gives us precisely numbers for (example) how many L1 cache hits and misses happened in a code block, how many branch mispredictions happened and so forth.
XLAT and CISC
Now, what the heck is XLAT and why does it exist?
The basic idea behind the XLAT instruction is the idea behind Complex Instruction Set Computers (CISC), that states hardware should implement common instruction sequences with dedicated instructions that perform the same task but faster. This is the idea behind many of the weird x86 instructions (or other CPUs).
However, since that time, all modern CPUs have turned RISC-like, by internally using a reduced instruction set and translating the ISA opcodes into internal commands, some implemented using CPU microcode. This also allows for different optimizations such as micro opcode fusion. Another note, CPU designers spend a lot of time optimizing the commonly use instructions, which makes them very fast (for example xor rax,rax is free) This leaves very little room for opcodes like xlatb to shine.
While we’re dunking on CISC, I came across the following great snippet on the difference between the good parts of CISC and the bad parts.
We should distinguish the “Complex” instructions of CISC CPUs - complicated, rarely used, and universally low performance, from the “Featureful” instructions common to both CISC and RISC CPUs, which combine a small sequence of operations, are commonly used, and high performance. - erincandescent
The experiments
What I ended up doing was running the different code snippets in the Andreas Abel’s micro benchmarking harness, available on GitHub. The machine used for execution was a VM running on a Broadwell i7-5500U, Debian 9.9, kernel version 4.9 with the host CPU frequency governor set to disabled (max clock speed all the time).
The executed code snippets were as described in the table below.
| Snippet 0 | Snippet 1 | Snippet 2 | Snippet 3 |
|
```nasm
push rcx
xor rcx,rcx mov cl,al add rcx,rbx mov al, [rcx] pop rcx |
```nasm
push rcx
movzx rcx,al mov al, [rbx+rcx] pop rcx |
In order to remove as much variance as possible, it’s best to make sure all accesses are kept inside the L1 cache (code and data). For this reason, the following initializations are required
- Aim RBX at RSP, making sure the array accessed is inside the L1 data cache
- Set RAX to 0
In addition, this opcode sequence is small enough to be in the same L1 code cache line so no effort was required there (manually verified).
For this experiment, what matters is the number of cycles required to execute (which is a close approximation of time) and the cycles elapsed (wall time). In addition, I’ll also measure how many loads happened while executing this snippet, by tracking the MEM_LOAD_UOPS_RETIRED.L1_HIT PMC.
The command line I used when executing the benchmarks was
./nanoBench.sh -avg -n_measurements 500 -asm_init "mov rbx, rsp;xor rax,rax;" -asm SNIPPET_HERE -config configs/cfg_Broadwell_common.txt
The results, summarized in a table:
| Snippet 0 | Snippet 1 | Snippet 2 | Snippet 3 |
|---|---|---|---|
| RDTSC: 6.35 | RDTSC: 6.00 | RDTSC: 4.81 | RDTSC: 5.6 |
| Core cycles: 8.01 | Core cycles: 7.02 | Core cycles: 6.36 | Core cycles: 7.01 |
| Loads: 2 | Loads: 2 | Loads: 2 | Loads: 2 |
There are a few things that stand out.
Foremost, xlatb is slower than the equivalent optimized x64 code.
Second, as is generally known, memory loads are the most expensive part of any algorithm, but once the data is in L1, the difference in number of loads doesn’t seem to matter. The xlatb sequence has only one data load yet is slower than the optimized x64 version.
Second, the core cycle count for the xlatb instruction precisely matches the Agner table (page 229). Good to know our measurements line up with others :)
Last, note that reducing the amount of instructions used does not decrease time required linearly. Why? The number of instructions is not linearly correlated to the actions performed by the processor. A classic example is xor rcx,rcx. This opcode never actually executes. Instead, the CPU just updates a pointer in the register renaming file.
To examine these type of questions, another tool is required - the Intel Architecture Code Analyzer (IACA - unfortunately now deprecated). This tool will look at the machine code and tell you how different Intel CPUs will execute them. Let’s look at one case in particular to see why removing instructions doesn’t always linearly save time. Attached are only the relevant parts of the output, which are the micro-op count.
* - instruction micro-ops not bound to a port
^ - Micro Fusion occurred
| Number of Uops | opcodes | Number of Uops | opcodes |
|---|---|---|---|
| 3^# | push rcx | 3^# | push rcx |
| 1* | xor rcx,rcx | 1* | movzx rcx,al |
| 1 | mov cl,al | 1 | add rcx, rbx |
| 1 | add rcx,rbx | 1 | mov al, byte ptr [rcx] |
| 1 | mov al, byte ptr [rcx] | 2^# | pop [rcx] |
| 2^# | pop rcx |
The important bit is noting that in snippet 0, the opcodes xor rcx,rcx; mov cl,al takes up one execution unit (xor rcx rcx is not bound to an execution port).
In snippet 1, the opcode movzx rcx,al doesn’t take up an execution port at all.
You can also play around with llvm-mca which does something similar, and see the same results, by using Compiler Explorer (snippet link).
Side note on actually running the experiments
All my machines are Windows machines, where accessing the PMCs is not as fun or easy as it is on Linux. The proper reaction should be “so run it inside a VM”, but apparently Hyper-V doesn’t expose PMCs to guests by default and I couldn’t find a way to do it easily.
I ran into every possible frustration while searching for a cheap bare metal cloud machine, including Oracle gating the bare metal instances behind a request form that requires a human being to look at.
In the end, VMWare Workstation exposes PMCs to guests so a friend with power to spare gave me a VM to test.
TL;DR
The meme is wrong, no surprise. An optimized sequence of x64 instructions beats out a single complex instruction. This isn’t always true (POPCNT as a counter example) but some instructions are legacy for a reason. If LLVM doesn’t output the opcode, it’s probably for the best.
Also this was an opportunity to rediscover micro benchmarking. It’s quite likely I made some measurement mistakes, so if you found any, feel free to contact me.
Also, thanks are in order for help in this bit of fun
@wobel_ for providing the VM and therapy while I swore at cloud providers.
@damageboy for generally knowing everything and in this case, for writing a series of blog posts on micro benchmarking .NET instructions available here that pushed me to do this sort of stuff
And again to Andreas Abel for saving me a lot of time with his micro benchmarking harness available on GitHub